The Ferrell lab studies signal transduction and cell cycle regulation, mainly focusing the spatial and temporal regulation of mitotic entry and exit. A good deal is known already about the individual proteins that regulate these processes, which allows us now to begin to explore how these proteins work together in circuits, generating reliable systems-level behaviors.
Much of our work makes use of Xenopus laevis oocytes, eggs, embryos, and extracts, which provide a wealth of advantages for quantitative studies of cell cycle regulation. We also make use of mammalian cell lines, which have their own advantages, including the fact that they are less amphibian than frog cells.
Here we have collected some information in FAQ format about the lab’s past and present research. You can skip to the page you are most interested in by clicking one of the links on the left.
Or you can just start here, with a discussion of what we think systems biology is. The following is adapted from a paper published in the Journal of Biology in 2009.
Systems biology is the study of complex gene networks, protein networks, metabolic networks and so on. One goal, perhaps the main goal, is to understand the design principles of living systems.
 How complex are the systems that systems biologists study?
That depends. Some people focus on networks at the ‘omics’-scale: whole genomes, proteomes, or metabolomes. These systems can be represented by graphs with thousands of nodes and edges, like the hairball shown on the right (courtesy of Marc Vidal). Others, including our group, tend to focus on small subcircuits of the network – say a circuit composed of a handful of proteins that functions as an amplifier, a switch, a pulse generator, an oscillator, or a logic gate. Typically, the graphs of these systems possess fewer than a dozen (or so) nodes. Both the large-scale and smallscale approaches have been fruitful.
 Why is systems biology important?
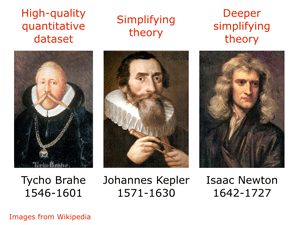
Stas Shvartsman at Princeton tells a story that provides a good answer to this question. He likens biology’s current status to that of planetary astronomy in the pre-Keplerian era. For millennia people had watched planets wander through the nighttime sky. They named them, gave them symbols, and charted their complicated comings and goings. This era of descriptive planetary astronomy culminated in Tycho Brahe’s careful quantitative studies of planetary motion at the end of the 16th century. At this point planetary motion had been described but not understood.
Systems biology begins with complex biological phenomena and aims to provide a simpler and more abstract framework that explains why these events occur the way they do. Systems biology can be carried out in a ‘Keplerian’ fashion – look for correlations and empirical relationships that account for data – but the ultimate hope is to arrive at a ‘Newtonian’ understanding of the simple principles that give rise to the complicated behaviors of complex biological systems.
Note that Kepler postulated other less enduring mathematical models of planetary dynamics. His Mysterium Cosmographicum showed that if you nest spheres and Platonic polyhedra in the right order (sphere-octahedron-sphere-icosahedron-sphere-dodecahedron- sphere-tetrahedron-sphere-cube-sphere), the sizes of the spheres correspond to the relative sizes of the first six planets’ orbits. This simple, abstract way of accounting for empirical data was probably just a happy coincidence. Happy coincidences are a potential danger in systems biology as well.
In a limited sense, yes. Some emergent properties disappear when you reduce a system to its individual components. It takes a circuit, not a single protein or gene, to function as an oscillator, a switch, or an amplifier. As Linus Pauling put it, “life is a relationship among molecules and not a property of any molecule.”
That said, systems biology stands to gain a lot from reductionism, and in this sense systems biology is anything but the antithesis of reductionism. Just as you can build up to an understanding of complex digital circuits by studying individual electronic components, then modular logic gates, and then higher-order combinations of gates, one may well be able to achieve an understanding of complex biological systems by studying proteins and genes, then motifs, and then higher-order combinations of motifs.
No.
 Oocytes are the postmitotic cells in the ovary slated to become fertilizable eggs. Fully grown (Daudin Stage VI) Xenopus oocytes are attractive brown-and-cream colored spheres about 1.2 mm in diameter. As cells go, they are gargantuan.
The events that culminate in the production of an immature, G2-arrested oocyte are referred to as oogenesis.
Frog oocytes start out life as large but not gargantuan cells, and they go through a normal G1 phase and a normal S phase. They then pair up their homologous chromosomes and undergo meiotic recombination. Once that is completed they enter a growth phase where they grow ~250,000-fold in volume, mass, and protein and RNA content. Then they stop growing and enter what is essentially a G2-phase arrest, with a stockpile of tyrosine-phosphorylated, inactive cyclin-Cdk1 complexes.
This can be viewed as the default fate of the oocyte, and the oocyte can remain in this stable, arrested state for months.
If the frog’s endocrine system thinks the time is right for making tadpoles, it produces gonadotropins that induce the secretion of the steroid hormone progesterone by the epithelial follicle cells that surround each oocyte in the ovary. Progesterone acts on the oocyte through non-traditional, plasma membrane-associated receptors, causing the oocyte to be released from its G2-phase arrest and begin the process of oocyte maturation.
Biochemically, oocyte maturation begins with a drop in cAMP levels, activation of Aurora A, up-regulation of Mos translation and stability, activation of the Mos/MEK (MEK1)/MAP kinase (p42 MAPK or ERK2) cascade, and ultimately activation of cyclin-Cdk1. Active cyclin-Cdk1 drives the migration of the oocyte’s huge nucleus (or germinal vesicle) to the animal pole of the cell, which causes a white spot to appear there. This is accompanied by germinal vesicle breakdown (GVBD), expulsion of the first polar body, and then the arrest of the oocyte in metaphase of meiosis II. At this point the oocyte is said to be mature.
The metaphase II-arrested state can be thought of as the induced fate of the oocyte, and it is a stable state too; the mature oocyte can stay arrested in meiosis II for a day or so, whereupon it will either be fertilized or die an apoptotic death. More info on this process can be found here and here.
Although the details of oocyte maturation vary from species to species, there are a number of recurring themes. The technical advantages of Xenopus oocytes – their large size, easy accessibility, and their ability to reilably undergo maturation in vitro – make them a great model system, and Xenopus oocyte maturation has become a benchmark against which other maturation processes are compared. So even if you don’t care about frogs, if you are interested in, say, human fertility, contraception, and reproduction, it’s good to know about Xenopus oocyte maturation.
More generally, you can think of Xenopus oocyte maturation as an interesting example of a cell fate induction process, and cell fate induction occurs over and over again in development. The themes and principles underlying Xenopus oocyte maturation can be seen in other cell fate induction processes.
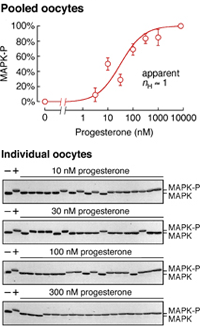 Not if you look at the average level of MAPK phosphorylation (a marker of activation) in populations of oocytes, as shown in the dose/response plot on the right. The response of MAPK is graded, well-approximated by a Hill function with an Hill exponent of 1.
But if you look in individual oocytes, which is possible because an oocyte contains a lot of protein (~25 µg), you see something completely different. As shown in the blots on the left, each individual oocyte either has its MAPK 100% phosphorylated (in the upper band) or it has its MAPK 100% dephosphorylated. Thus the individual oocytes’ responses are all-or-none in character.
In a sense they are. At the level of the individual moleule, a MAPK protein is either inactive or active (where by “active” we mean ~600,000-fold higher in activity than the inactive protein is, as shown by John Lew’s lab here). But an oocyte contains around 180,000,000,000 MAPK moleules, so there is the potential for an almost infinitely-graded range of MAPK activity states.
Bistability. The activity of p42 MAPK is controlled by a bistable circuit.
 Mos activates MAPK via MEK1, and then active MAPK feeds back to activate Mos translation. This is a positive feedback loop, and positive feedback is essential for any bistable circuit.
In addition, even in the absence of positive feedback the MAPK cascade generates an ultrasensitive steady-state response. By “ultrasensitive” we mean that the stimulus/response curve for MAPK activity as a function of Mos is well approximated by a Hill curve with a Hill exponent of 5 (as experimentally shown here). The combination of the ultrasensitive response of MAPK to Mos, and the positive feedback from MAPK to Mos, allows the system to be bistable and to generate an all-or-none response.
The bistability of the system, and the transition of the bistable system from off to on, can be understood through a rate-balance plot.
It is sort of like the supply/demand plots that economists use. They plot supply and demand as functions of price on one set of axes, and where the curves intersect, that is the equilibrium price of that commodity.
We plot the rates of Mos synthesis and Mos degradation as a function of the concentration of Mos present. Where the rate curves intersect, synthesis and degradation are balanced and the system is in steady state.
First consider how the rate of Mos degradation should vary as the concentration of Mos varies. The simplest case, which we will assume here, is that Mos degradation increases linearly with the concentration of Mos present. This is shown as the blue curve below.
 The synthesis rate curve is a bit more complicated. Here we have plotted three such curves, corresponding to three levels of the input stimulus progesterone. With the bottom curve (prog = 0) we imagine that the rate of Mos synthesis is zero if the Mos protein concentration is zero, and that the rate increases as Mos increases because of the positive feedback loop. Since MAPK activity is an ultrasensitive function of Mos, we assume that the rate of Mos synthesis is an ultrasensitive function of the Mos concentration as well. Hence the sigmoidal red curve. Here we have chosen it to be high enough to snake around the blue line.
The red curve intersects the blue curve at three points, which means there are three steady states for the system: an “off-state” with zero Mos (and zero active MAPK), an “on-state” with high Mos (and almost all of the MAPK active), and a steady state that is intermediate. The off- and on-states are stable (designated SSS in the plot above) and the the middle one is an unstable steady state (USS) or threshold. Above it the system will move up to the on-state and below it the system will move down to the off-state.
As we add one unit of progesterone, we imagine that the basal (i.e. Mos-indepedent) rate of Mos synthesis increases. This shifts the red curve up vertically and changes the positions where the blue and red curves intersect. In particular, the off-state moves up and the threshold moves down. If we add another unit of progesterone, the red curve shifts up so far that the off-state and the threshold collide with and anhilate each other.
The input to the system (e.g. progesterone) can be thought of as driving the system through a saddle-node bifurcation, making a “saddle” (the USS) and a “node” (the off-state) disappear and forcing the system into the only remaining steady state, the on-state.
Active MAPK phosphorylates and activates the protein kinase Rsk2, which in turn phosphorylates and inactivates the protein kinase Myt1. Myt1 is an inactivator of Cdk1, so when Myt1 is turned off the Cdk1 can be turned on by an unopposed Cdc25C protein.
Cdk1 is embedded in its own set of positive feedback and double-negative feedback loops, which we will discuss further in our next installment. We have hypothesized, but not verified, that the two systems operate on different time scales: the p42 MAPK system, which uses tranlational positive feedback, a time scale of tens of minutes, and the Cdk1 system, which uses phosphorylation and dephosphorylation, a time scale of a couple of minutes. These dual-time systems can be very useful for switching quickly while still rejecting noise; click here for more discussion on this.
Not during oocyte maturation. You can see this in the rate balance analysis of the modeled system shown above. When you add progesterone, the red curves shift up and the system is forced into the only remaining steady state, the high-Mos state. But if you wash away the progesterone and shift the red curve back down, the stable high-Mos state does not disappear (it just shifts to the left slightly), and so the system would not be expected to flip back down to the low-Mos state. This rationalizes why the mature oocyte is locked in a stable steady-state with the positive feeback keeping the level of Mos and the activity of p42 MAPK high.
And, in fact, you can see the same thing in experiments on the actual biological system. If you wash away the progesterone from a mature oocyte, and it will stay mature, with high p42 MAPK and Cdk1 activities, for many hours. But if you perturb the positive feedback by blocking Mos synthesis, the irreversible activation of p42 MAPK and Cdk1 becomes reversible. Thus the positive feedback loops do generate an actively-maintained “memory” of the inductive stimulus progesterone (as shown by Wen Xiong; click here).
However, once a mature oocyte is ovulated and fertilzed, the positive feedback does turn back off. This happens because fertilization causes cyclins to be degraded, turning Cdk1 off, and causes Mos to be degraded, turning p42 MAPK off. Cyclin gets resynthesized during the ensuing mitotic cell cycles in the embryo, but Mos levels stay low.
 No. If the system is deterministic, the bistable switch can either be irreversible, like the p42 MAPK/Cdk1 system in oocytes, or hysteretic. As discussed in the next installment, the Cdk1 system in G2/M control (which does not operate together with a Mos/MEK/MAPK cascade) is hysteretic.
In either case, if the bistable system is noisy enough, it may be able to equilbrate between its two stable steady states, which is another kind of reversibility. The Collins lab’s synthetic toggle switch is an example of this sort of behavior, as seen here. But the oocyte’s toggle switch is strong enough to keep the cells from equilibrating between the “on” and “off” states.
You bet. Bistability from transcriptional positive feedback is at the heart of the famous lambda bacteriophage lysis-lysogeny switch, and at heart of the famous beta-galactosidase induction system in E. coli. Muscle cell differentiation in culture depends upon another transcriptional positive feedback circuit. Fat cell differentiation in culture depends upon transcriptional positive feedback too.
Memories are probably maintained by cellular circuits in the brain that function as bistable switches. Epigenetic chromatin modification states are probably maintained by bistable circuits. Prion-mediated disease states are maintained by positive feedback loops that probably make the system bistable.
And in cell cycle regulation, a bistable switches control both the G1/S transtion and the G2/M transition. Much of the Ferrell lab’s work has focused on the G2/M switch.
Early experimental studies showed that active Cdk1 could promote its own activation (by activating Cdc25) and inhibit its own inactivation (by inhibiting Wee1 and Myt1). Computational biologists (e.g. Tyson, Novak, and Thron) recognized that these feedback loops could constitute a bistable switch, aka the mitotic trigger.
 So is there a bistable trigger for mitosis?
There is in Xenopus egg extracts, and presumably in many other cells and organisms as well. This was shown by experiments done in Jill Sible’s lab (see here) and by Joe Pomerening in the Ferrell lab (right). When you dial up the cyclin concentration in an interphase extract, Cdk1 activity rises sharply once the cyclin exceeds about 70 nM. If you start with an M-phase extract and dial down the cyclin, the Cdk1 activity decreases and then falls more precipitously at a cyclin concentration of about 40 nM. Between 40 and 70 nM the system is bistable, with two alternative steady state.
The oscillations fizzle out faster than normal if you take Wee1 and Cdc25 out of the equation; see here. And mammalian tissue culture cells have problems locking themselves into interphase after mitotic exit if you inhibit Wee1; see here.
Note that intact Xenopus embryos require this trigger during their first post-fertilization cell cycle, but surprisingly they do not require it during cycles 2-12. So the cell cycle seems more robust in embryos than it is in extracts. See here. The current thinking is that a second trigger centered on the Greatwall kinase and PP2A-B55 also contributes to the bistability of Cdk1 (and in fact it may be more important than the Wee1/Cdc25 circuit for making Cdk1 activation be explosive and bistable), and that this trigger is enough to drive the embryonic cell cycle pretty well. See here.
Yes. The steady-state response of Wee1 to Cdk1 is ultrasensitive, with an effective Hill coefficient of 3.5. And the steady-state response of Cdc25C to Cdk1 is even more ultrasensitive, with an effective Hill coefficient of about 11. See this and this.
Wee1 and Cdc25C require multisite phosphorylation to be inactivated (Wee1) and activated (Cdc25C) by Cdk1. Multisite phosphorylation can generate ultrasensitivity, and multisite phosphorylation accounts for some of the ultrasensitivity observed. In the case of Wee1, competition with other higher affinity substrates appears to contribute to the ultrasensitivity as well.
Multisite phosphorylation is a recurring theme in cell cycle regulation, and in cellular regulation in general.
 One simple yet reasonably realistic model of the mitotic trigger is shown schematically on the right. The most important simplification is that it assumes that Cdc25 and Wee1 are always at steady state with respect to the concentration of active Cdk1 in the system. This is probably not strictly true, but it allows one to derive a closed form expression that relates the steady-state level of Cdk1 activity to the concentration of cyclin B1 and all of the rate constants, EC50 values, and Hill exponents for the system.
 All of the parameters for the model have now been determined experimentally except for one, the ratio of Wee1 activity to Cdc25 activity in the system. The model produces a family of possible stimulus/response curves, shown on the right, with each curve corresponding to a different value for the activity ratio. For a reasonable value of the ratio (0.5) you get a bistable, hysteretic curve that agrees well with experiment.
This agreement supports both the basic concepts underpinning the model – that the onset of mitosis corresponds to a traversal of a saddle-node bifurcation in a bistable control system built out of highly non-linear components – as well as the quantitative details of the model. See here for further discussion.
Cdc25 and Wee1 are mirror-image proteins in many ways. The former is a phosphatase; the latter a kinase. The former activates Cdk1; the latter inactivates it. The former is activated by Cdk1, and the latter is inactivated by it. The former is inactivated by DNA damage checkpoint activation, and the latter is activated by it.
As mentioned in the discussion of oocyte maturation, interlinked positive feedback loops can be advantageous if the loops operate on different time scales (see this). But Cdc25 activation and Wee1 inactivation seem to happen at virtually the same time when Xenopus extracts go into mitosis. Is there some advantage to a mirror image relationship when the time scales of the loops are similar?
 The answer is yes. It turns out that with a single positive (or double negative) feedback loop, bistability requires a fairly precise balance of protein concentrations. The mirror image arrangement allows the loops to work as a bistable switch over a much wider range of concentrations. This can be seen in rate balance plots, as shown on the right. If you have one loop, the system can tolerate a change of ~ ±30% in the concentration or activity of the inactivator protein. But with two loops, the system can tolerate a ~ ±300% change.
Yes. The famous G1/S transition in budding yeast (“Start”) happens when a transcriptional bistable switch is thrown. The same is thought to be true of the G1/S transition in mammalian cells. And in both cases, mirror image, interlinked positive and double negative feedback loops are involved. See here for a review.
The combination of positive feedback and bistability is a simple way of building all-or-none, hysteretic or irreversible responses out of intrinsically graded and reversible components. We suspect that nature commonly uses this type of regulation when decisive biological responses are needed.
Add two things: cyclin synthesis, which drives the bistable trigger from interphase to M-phase, and a negative feedback loop where Cdk1 activation results in the activation of APC/C(Cdc20).
 In dynamical terms, the result is a system that now possesses two steady-state stimulus/responses relationships or nullclines, one for Cdk1 as a function of cyclin and one for cyclin as a function of Cdk1. If the shape of this second (cyclin) nullcline is just right, the system will have a single steady state and the steady-state will be unstable. Instead of settling into a steady state, the system orbits it, essentially marching around the hysteretic stimulus/response relationship defined by the bistable trigger (the Cdk1 nullcline). This orbit around the hysteretic stimulus/response relationship is a stable limit cycle.
 Yes. Qiong Yang showed that in Xenopus egg extracts the response is, in fact, ridiculously ultrasensitive, with an apparent Hill exponent of about 17. She measured this by monitoring the rate of securin-CFP degradation as a function of the concentration of non-degradable cyclin B1 added to the extract, as shown on the right. Tony Tsai showed that in extracts from later stage embryos, the apparent Hill exponent is even higher. See here and here.
Probably a number of things contribute. Multisite phosphorylation of the APC/C complex, for one thing. Multisite dephosphorylation of the Cdc20 protein for another.
But while it is possible to achieve a response that is this switch-like through mechanisms like this, we suspect the response might actually be bistable, with positive or double negative feedback built into the APC/C(Cdc20) response. The late Béla Novák hypothesized a plausible mechanism for this feedback.
Sure. The cell cycle oscillator is built out of a bistable Cdk1/Cdc25/Wee1/PP2A toggle switch, with cyclin synthesis flipping the switch on and then APC/C(Cdc20) activation flipping the switch back off.
Not necessarily. In principal you can build an oscillator from a long, time-delayed negative feedback loop without a bistable trigger. Michael Elowitz’s Repressilator is an example of that type of oscillator, and the famous Goodwin oscillator model from the mid-1960’s is another.
As mentioned above, in Xenopus embryos, at least the Wee1/Cdc25 part of the bistable switch does not appear to be essential for cycling. And in S. pombe, even though Wee1 is normally an essential gene, it becomes inessential in a system running off a minimal Cdk1-cyclin fusion protein. So even in cell cycle regulation, a bistable trigger is not always essential.
That said, it is striking how many biological oscillators do have a bistable trigger coupled to a delayed negative feedback loop. Think of pacemaker action potentials in the heart’s AV node, or calcium oscillations in brain tissue. Nature appears to have settled on the same basic design over and over again. Further discussion of the advantatges of different oscillator designs can be found here.
Here you go:
 Maybe not. For a typical-sized somatic cell, all you would need would be for the Cdk1 to become activated abruptly at some given location (current evidence suggests that it is first activated at the centrosome). Then even a process as inefficient as random walk diffusion would allow the active Cdk1 to make its way to every nook and cranny of the cell in a pretty short time period.
The time it takes to diffuse a distance d in three dimensions is given by t = d2/6D. A typical value for the diffusion coefficient of a cytosolic protein is 10 µm2/sec, so for the active Cdk1 to diffuse a distance of, say, 10 µm (which is the radius of a 4 pL spherical cell), it would take 1.67 sec. As long as you do not require that the synchrony of nuclear and cortical mitotic events be better than plus-or-minus a few seconds, random walk diffusion should be sufficient.
But a Xenopus egg is 60x the radius of our typical somatic cell, and so diffusion would take 3600x longer: 1.67 h rather than 1.67 sec. This might suggest that mitosis would be a long drawn out process in a frog egg. But it is not; there is only a lag of about 10 min between when nuclear envelope breakdown happens near the center of the egg and when the Cdk1-dependent surface contraction wavse begin at the animal pole. Something quicker than random walk diffusion must be involved in the spatial coordination of mitosis.
Probably not. It would be fast enough – typical rates of microtubule based transport are about 1 µm/sec – but Hara and Kirschner showed years ago that cortical contractions happen once every 25 min in devitellinated frog embryos, probably due to the once-per-25-min activation of Cdk1, and that the microtubule poison colchicine doesn’t slow or smear-out these contractions.
Flow is another way of getting information through a system faster than diffusion alone would permit, but the flows in a fertilized embryo are pretty limited.
One idea is inspired by the fact that Cdk1 promotes its own activation. Suppose then that Cdk1 gets activated somewhere – say at the centrosome or in the nucleus. The active Cdk1 can diffuse the first short distance, say a µm, very quickly since diffusion is fast over short distances, and then cause all of the inactive Cdk1 in that region of cytoplasm to get activated. Then it won’t matter if half of the original active Cdk1 molecules random walk backward; there will be all this newly generated active Cdk1 to keep pushing the activity front outward.
These cycles of diffusion and autocatalytic reaction would allow the activity of Cdk1 to propagate outward from the centrosome, and without slowing down or petering out. This type of phenomenon is termed a trigger wave.
Action potentials propagating down an axon, for one. The positive feedback comes from the voltage-activated sodium channel. Calcium waves, for another, with the postive feedback coming from calcium-dependent IP3 generation and calcium-induced calcium release. Cyclic AMP waves in aggregating Dictyostelium for another.
Or, if you are willing to leave the realm of cellular regulation, the spread of a virus through a population, or the spread of a rumor through the internet, or the spread of a fire through a field would all be examples of trigger waves.
The three things you need for a trigger wave are (1) a bistable regulatory system (or an excitable system or a relaxation oscillator, which can be thought of as bistable systems with the addition of strong negative feedback); (2) a spatial coupling mechanism, which here we are assuming is diffusion, but in other contexts could be, say, a cell-cell or organism-organism interaction; and (3) some inhomogeneity to allow the bistable switch to be flipped at some region of space before it has been flipped in the surrounding regions.
Sure. Start with a simple ordinary differential equation (ODE) model of the cell cycle oscillator as mentioned in the discussion of the embryonic cell cycle oscillator. Add Fick’s law diffusion terms. Then solve the resulting partial differential equations (PDEs) numerically. If you do it for a one-dimensional system, like a long thin tube of cytoplasm, and assume that Cdk1 activation occurs early in one 5 µm section right in the middle of the tube, you get a kymograph of the system that looks like this:

The hot colors denote high levels of Cdk1 activity, and the cool colors low. The trigger waves propagate at a constant speed of about 1 µm/sec, and they eventually take control of the timing of mitosis in the whole tube.
Yes, at a constant speed of about 1 µm/sec, just like they do in the model. This is fast enough to get information from the center of an egg to the cortex in 10 min.
Through video microscopy experiments with cycling Xenopus egg extracts in thin (100 µm diameter) Teflon tubes. Have a look at a time-lapse (1 sec in the video = 15 min in real time) video of mitotic trigger waves by clicking here.
The green balls are interphase nuclei filled with GFP-NLS. When a nucleus goes through nuclear envelope breakdown, it gets emptied of its contents.
You can plot the times at which the nuclei disappear (red) and re-form (blue) as a function of their position in the tube, and the resulting kymograph is:

The straight lines are the propagating trigger waves. After a relatively disorganized first cycle, the extract is dominated by trigger waves originating at two foci and spreading at linear speed up and down the tube.
Evidence suggess that they start at or near the congressed pronuclei, which sit in the middle of the animal hemisphere of the egg. Our guess is that the waves originate from the centrosomes, since centrosomes are where you can first detect active Cdk1 in somatic cells. The trigger waves are thought to spread outward as near-constant velocity, reaching different parts of the cortex at predictable times (animal pole first, vegetal pole last).
Sure, it does seem likely, doesn’t it?